Agribusiness examines the commercial structure surrounding production: cooperatives and elevators, processors and input suppliers, farmland ownership and rental rates, agricultural credit, and consolidation among seed and chemical firms. Analysis explains how each affects a grower's margin. Aimed at farm owners, managers and the lenders and advisers working with them.
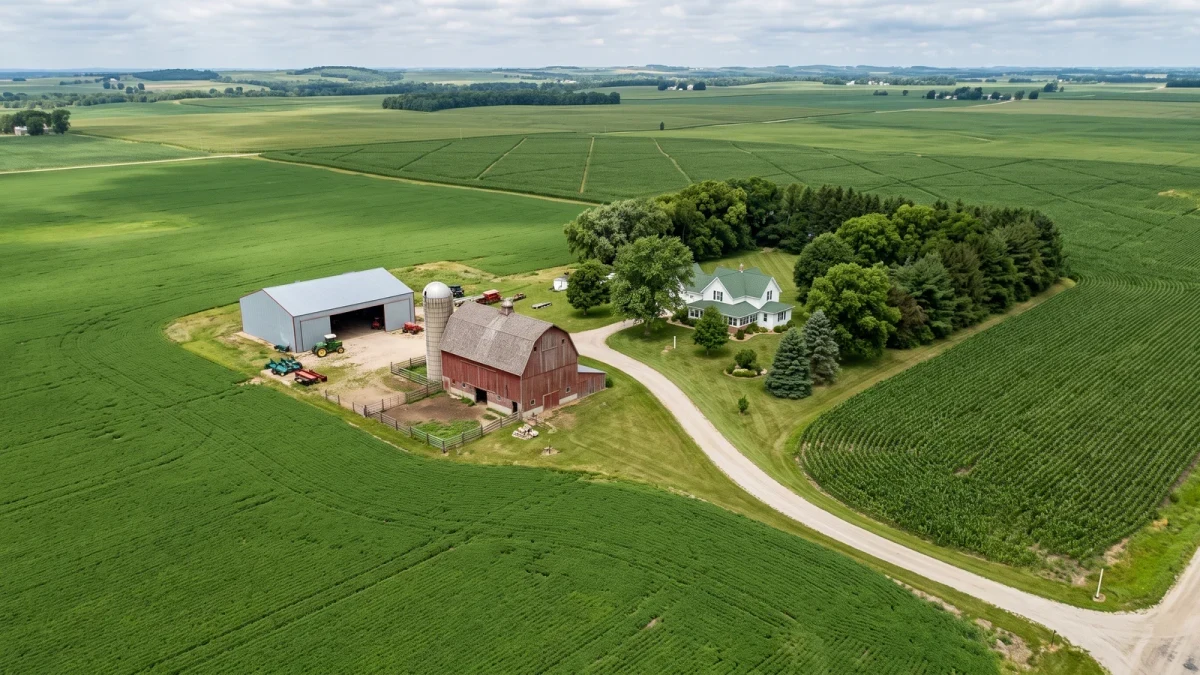
Fewer and larger farms, an average producer age of 58.1, and a renting majority of farmland acres: the census is the fullest picture of U.S. farm structure available.
The 2025 H-2A Adverse Effect Wage Rates averaged roughly $17.43 per hour nationally, per the Department of Labor data analyzed by the Economic Policy Institute, but wages are only about half the true cost once housing, transport, and compliance are counted.
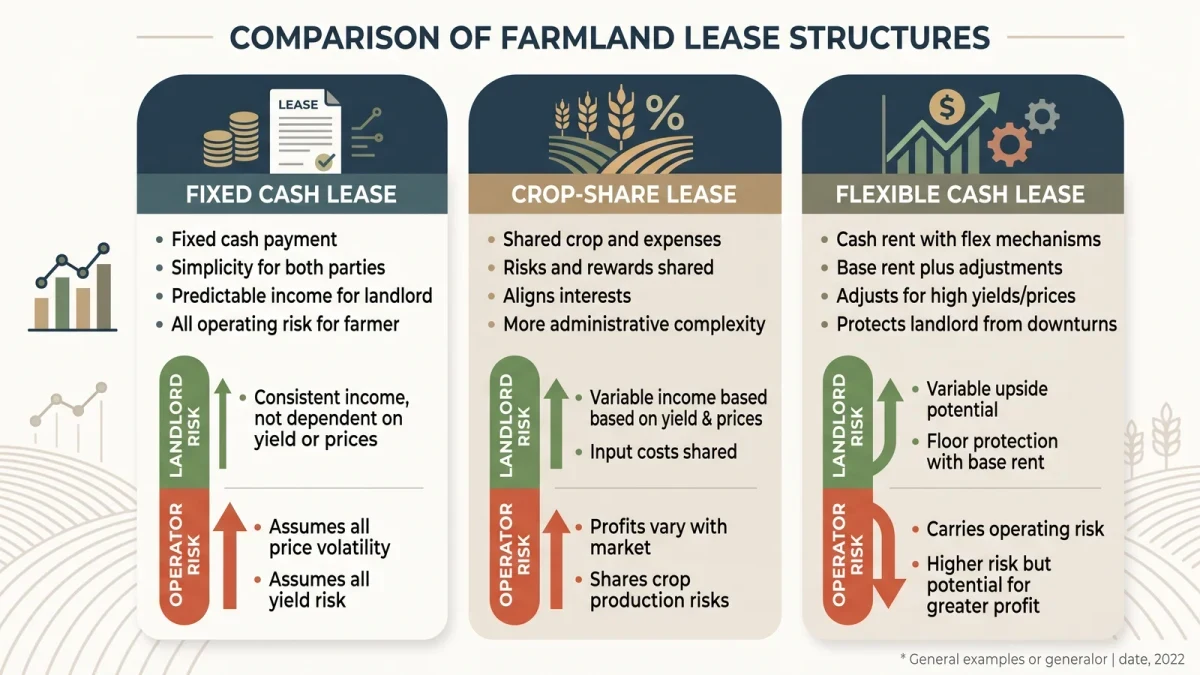
The national average cropland cash rent was $161 per acre in 2025, per USDA NASS, but the lease type a operator and landowner choose determines who carries the price and yield risk, not just who writes the check.
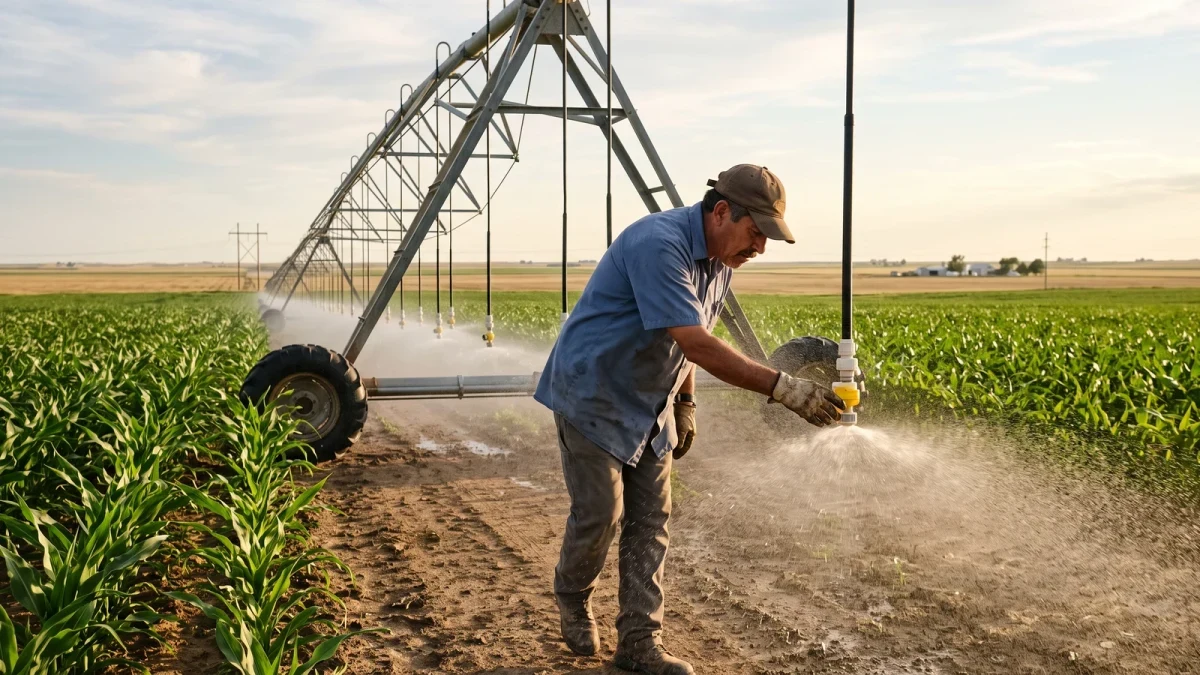
Across the Ogallala region, the aquifer, not the commodity price, is the cost driver: every foot the water table falls adds lift cost and inches producers closer to a decision about what to grow.
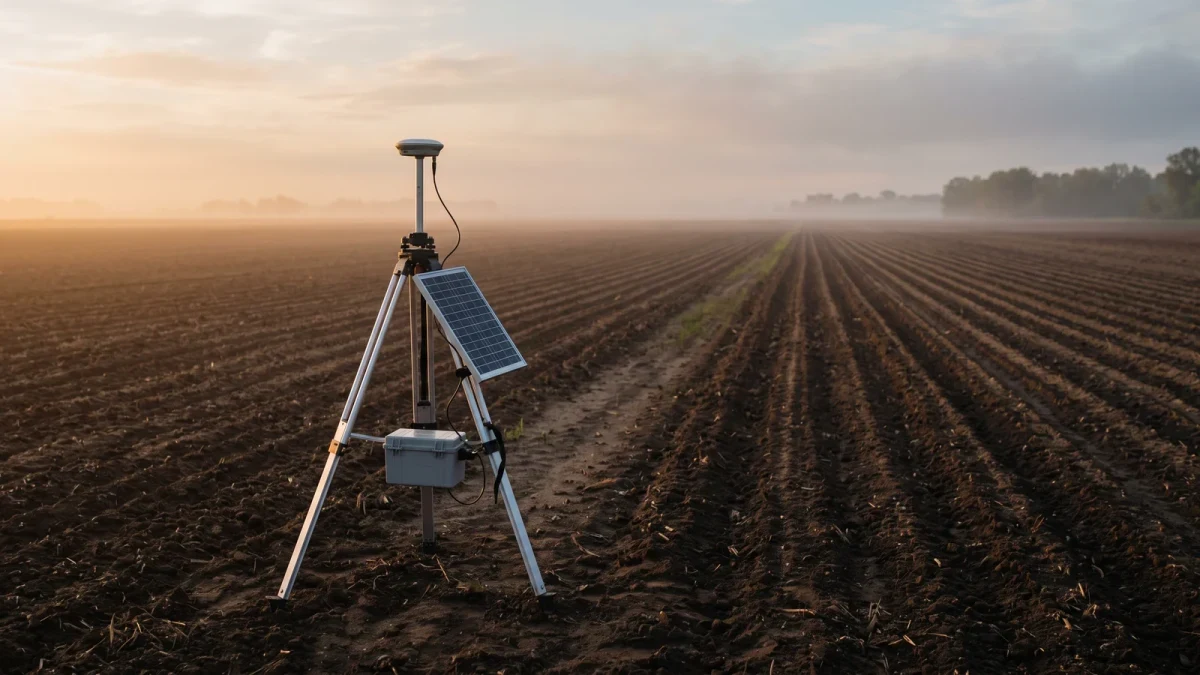
Guidance and autosteer cleared the ROI test on roughly half of U.S. row-crop acres; the harder question is which of the technologies stacked on top of them earn their subscription.